
Winners
Winners of the contest! From the left: Monika Kwiatkowska, Bartłomiej Karaban, Michał Miotk and Monika Krzyżanowska. On the right Kamil Marcin Kosiński, mentor of the event from PwC Polska - sponsor of the event! Congratulations.
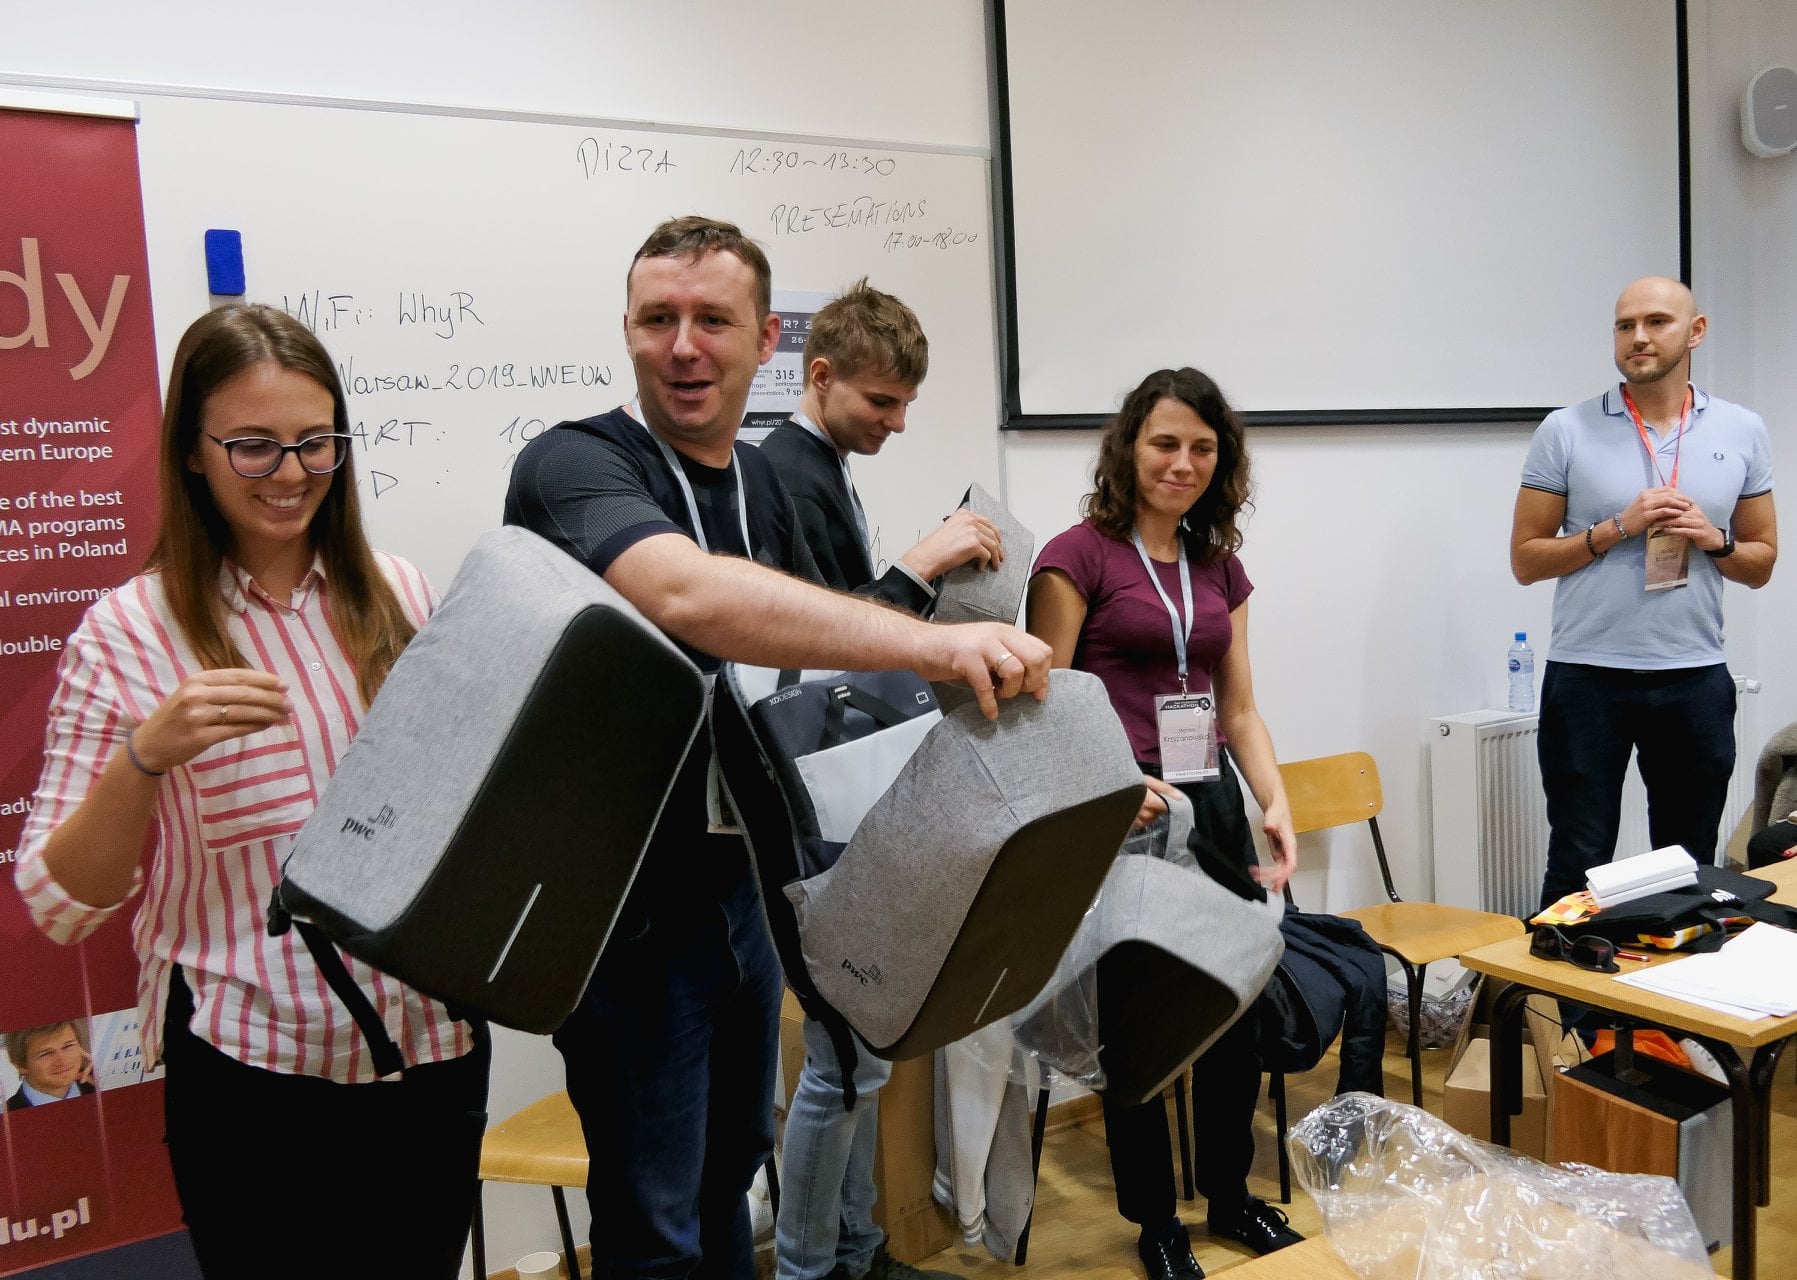
More photos here
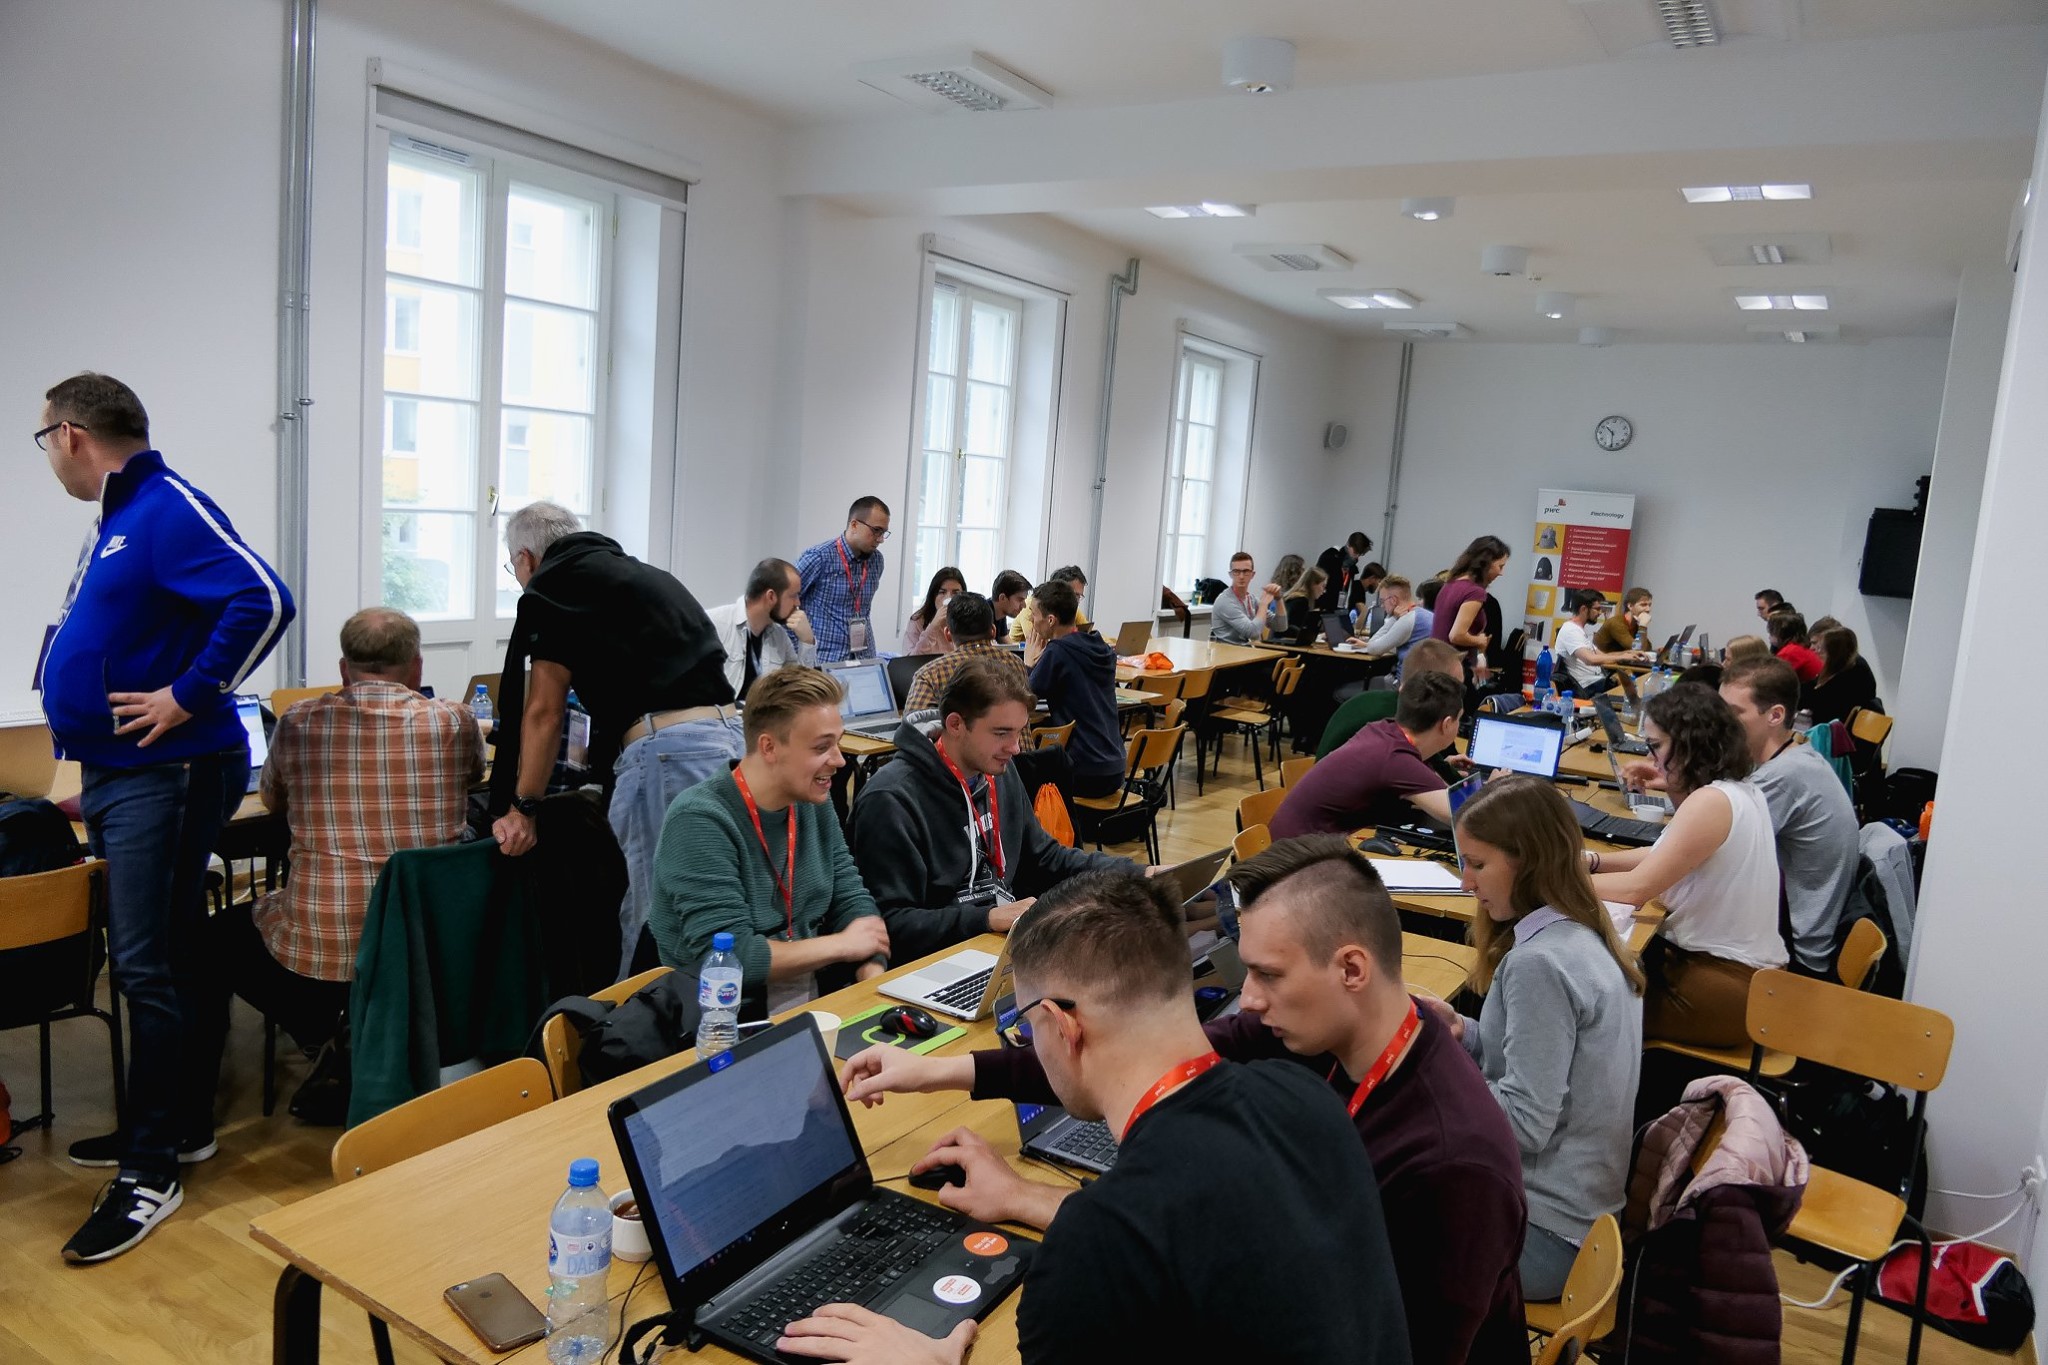
Table of Contents
| 1. Why data visualizations? | 2. Why Hackathon? | 3. The challenge |
| 4. Competition Rules | 5. Mentors and Judges | 6. Competition Rules |
| 7. For whom? | 8. Teams | 9. Registration (closed) |
| 10. Event details | 11. Organizers | 12. Confernece |
Why data visualizations?
Nowadays data has become an invaluable resource where those who can transform data into meaningful information are the ones to make a difference in business and society. Making sense of data has become a matter of success and failure for companies and organizations around the world. It has also become one of the most needed skills on the labour market.
Being an expert in data visualization is considered as one of the most desired skills when dealing with the complexity of data and the challenge of information design. The data science community acknowledges that extracting insights from data does not only require skills in statistical modeling but also an ability to effectively visualize information.
Why Hackathon?
Hackathons are events where enthusiasts of a specific topic gather in one place to work together on challenges that arose for a particular community.
Hackathons tend to be timepressure events, where solutions need to be created quicky and active cooperation between participants is necessary. To set the pace of the event, participants are divided into teams which compete to prepare the most valuable solution and win a prize.
For a participant such an undertaking is a great chance to:
- develop the ability to work in group
- learn from more experienced practitioners
- take part in lectures and workshops related to data visualization
- have a remarkable networking experience
- participate in healthy and fair competition
- test his skills in comparison with the others
- win prizes
- learn new presentation techniques
- use new visualization tools
- brainstorm new business use cases
Sponsor
![]()
In PwC Data Analytics team we analyse collected data to build solutions and design models to predict future trends. There is no coincidence that clients from various sectors have trusted us -after all, we are among the top Data Scientists in the region. Would you like to join our team? Let’s stay in touch!
The best people participating in Data Visualization Hackathon will have opportunity to join the short recruitment process for the Data Analytics PwC team. Information about current job offers will be presented during the hackathon and sent via email to selected participants. For the best Hackathon teams we have prepared attractive prizes: anti-theft backpacks, wireless computer mice, USB sticks, etc. Looking forward to meet with you!
We are glad to support Why R 2019 Conference and be a part of your community!
The challenge
Mordor by day, banks of Vistula by night. Let’s find out which areas citizens of Warsaw visit most frequently! In this hackathon, we will track the behaviour of people based on the GCP data
Google Cloud Platform (GCP) enables 6 APIs that provide information about maps, traffic, routes or places around the globe. We decided to use GCP APIs to prepare a data set of places in Warsaw with the information about its type, address and geographical localization; where rating, number or reviews and occupancy (popular times per day) were taken from Google Search Engine!
Having such an interesting data one can immediately think about potential use cases!
- What is the best place to make a new advertisement in the city?
- What are the blank spaces on the map where a specific service is missing?
- Are the most crowded places properly equipped with a sufficient amount of city bike stations? What are the - moving/traffic trends throughout the day?
- Does the occupancy of the areas correspond to the real estate prices?
Imagine other use cases you can invent, the moment you link the data with other sources.
Competition Rules
Since the event is a competition with symbolic prices, we would like to grade solutions. It should be an innovative presentation of data that uses data visualization techniques to show interesting insights based on the Popular Times for Places data set.

Mentors and Judges
To provide solutions of the highest quality we have invited data visualization experts that will be available during the event for mentoring. At the time of closing presentations mentors will become judges of solutions and will score them based on the competition rules.

For whom?
We strongly encourage people with design thinking skills to participate in the event. We would love to create interdisciplinary teams made up of participants with various backgrounds. Graphic designers, data analysts, developers, storytellers, BI consultants, web designers, data enthusiast are all welcome since they can learn a lot from one another!!
- Have a good knowledge of data visualisation tools?
- Failiar with data visualization concepts and good practices?
- Want to meet people devoted to data visualizations?
- Passionate about proper techniques of presenting insights related to data analysis?
The event is made just for you!
Teams
We would like participants to gather in teams of 4 or 5. Each team should consist of members of various skills like: visualization prototyping, visualization designing, data munging, creativity, user experience designing, knowledge of data visualization tools. Please make sure your team has a broad variety of skills.
If you do not have a team, please join our slack channel to find out people willing to form a team. We are able to combine teams as well if you find it hard to gather a group of 4 or 5 on your own.
During the registration we will collect the list of your skills to adjust the difficulty level of the challenge and to inform judges about the overall advancement of participants. This can also help us create teams if you are unable to find one!
Registration (closed)
The Data Visualizations Hackathon is a free event. However, the registration is required. This will allow organizers to book a place with enough space and provide a sufficient amount of coffee, beverages, pizzas and gadgets.
On 13th September 3pm CEST we closed the registration due to the number of submissions exceeding our venue capacity!
Event Details
- Place: Faculty of Economic Sciences, University of Warsaw
- Address: Długa 44/50, Warsaw
- Date: 26.09.2019
- Start - open doors: 8:30
- Presentations: 17:00 - 18:00
-
End - closing remarks: 18:00
- For? For everyone interested in data visualizations and data presentation!
- Tech? No tech skills are needed to participate in the event!
Organizers